How to Build a GitHub Metrics Dashboard
Managing a GitHub repository is hard. Your developers are too valuable to waste their time on simple admin tasks, like pulling stats.
A quick way to overcome this is with a GitHub metrics dashboard.
With a dashboard, you can instantly see everything you need to know. You can use a dedicated app to find out what is working well or to discover and fix issues.
However, due to the unique nature of GitHub projects, it’s hard to find a pre-made dashboard that suits your needs.
The truth is that a lot of metrics depend on your workflow and how your team tracks them. Therefore, it’s often faster and more effective to build your own dashboard.
This seems counterintuitive until you realize how simple the process is. It’s just as easy as getting the hang of premade tools and trying to connect them to your repository.
Today we’ll learn how to build a custom tool with Budibase.
With our leading open-source, low-code platform, you can use premade components, connect to external APIs, query databases, visualize data, create automations, and much more.
You might also like our guide to building a Postgres GUI .
Let’s dive right in.
Your GitHub Metrics Dashboard
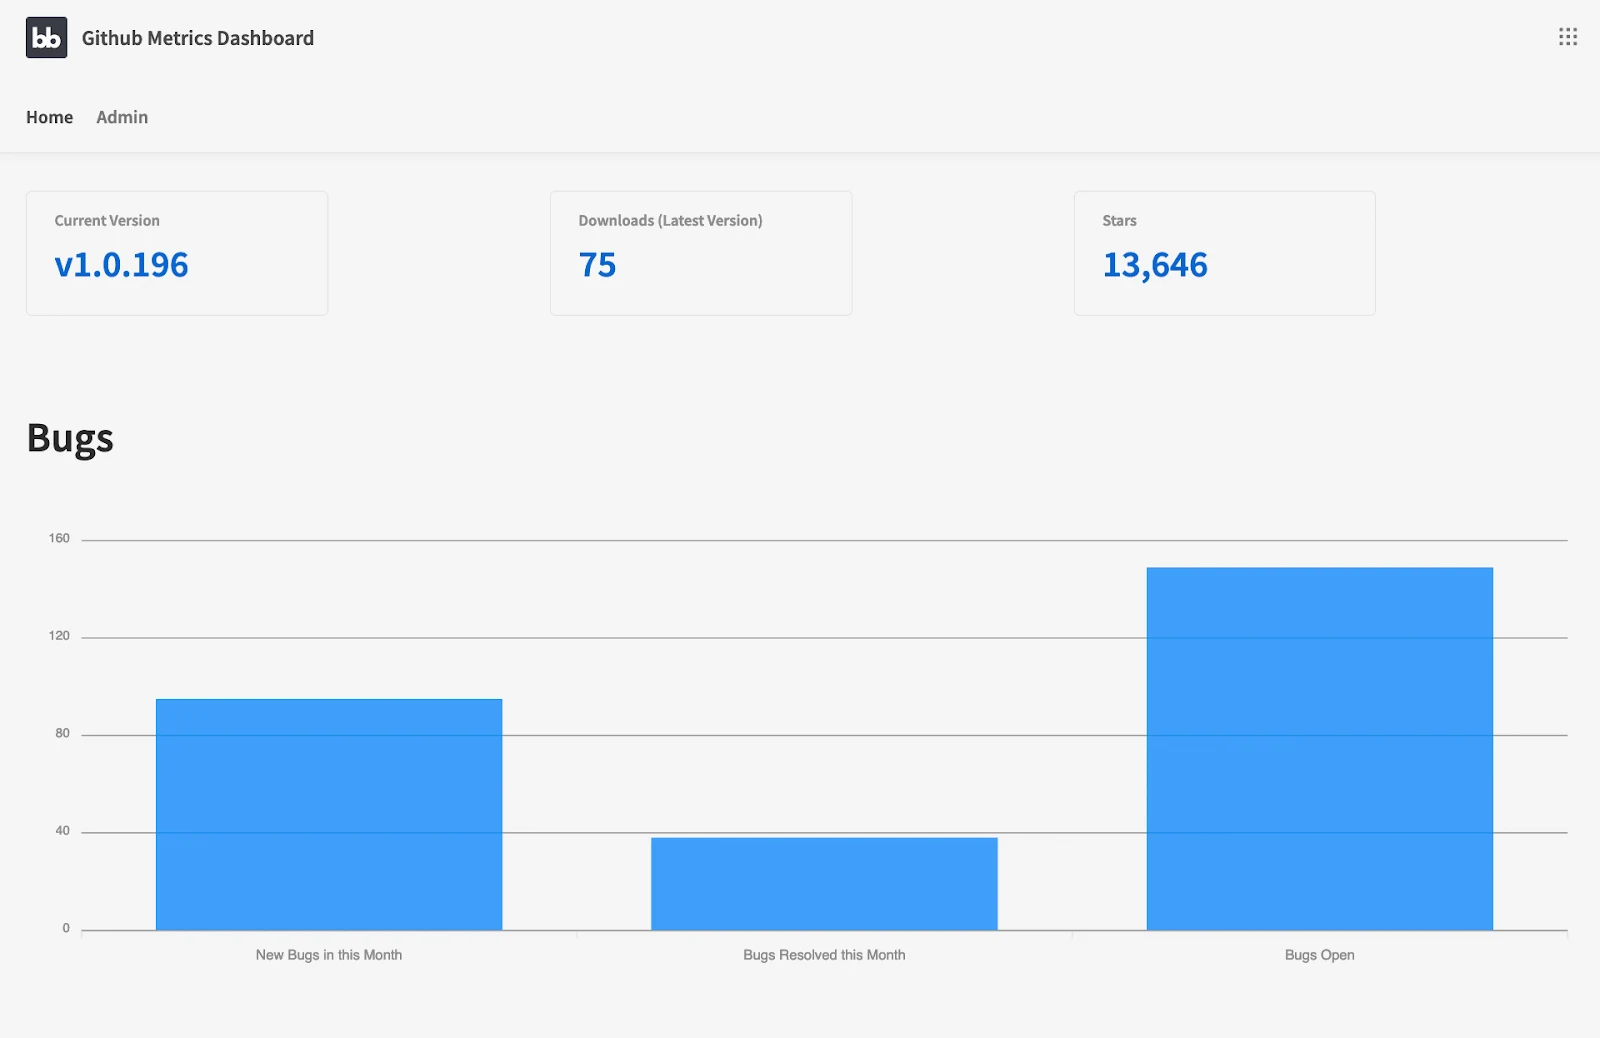
First, let’s look at the GitHub metrics tool you’ll create today:

Why not also check out our tutorial on how to build a dashboard ?
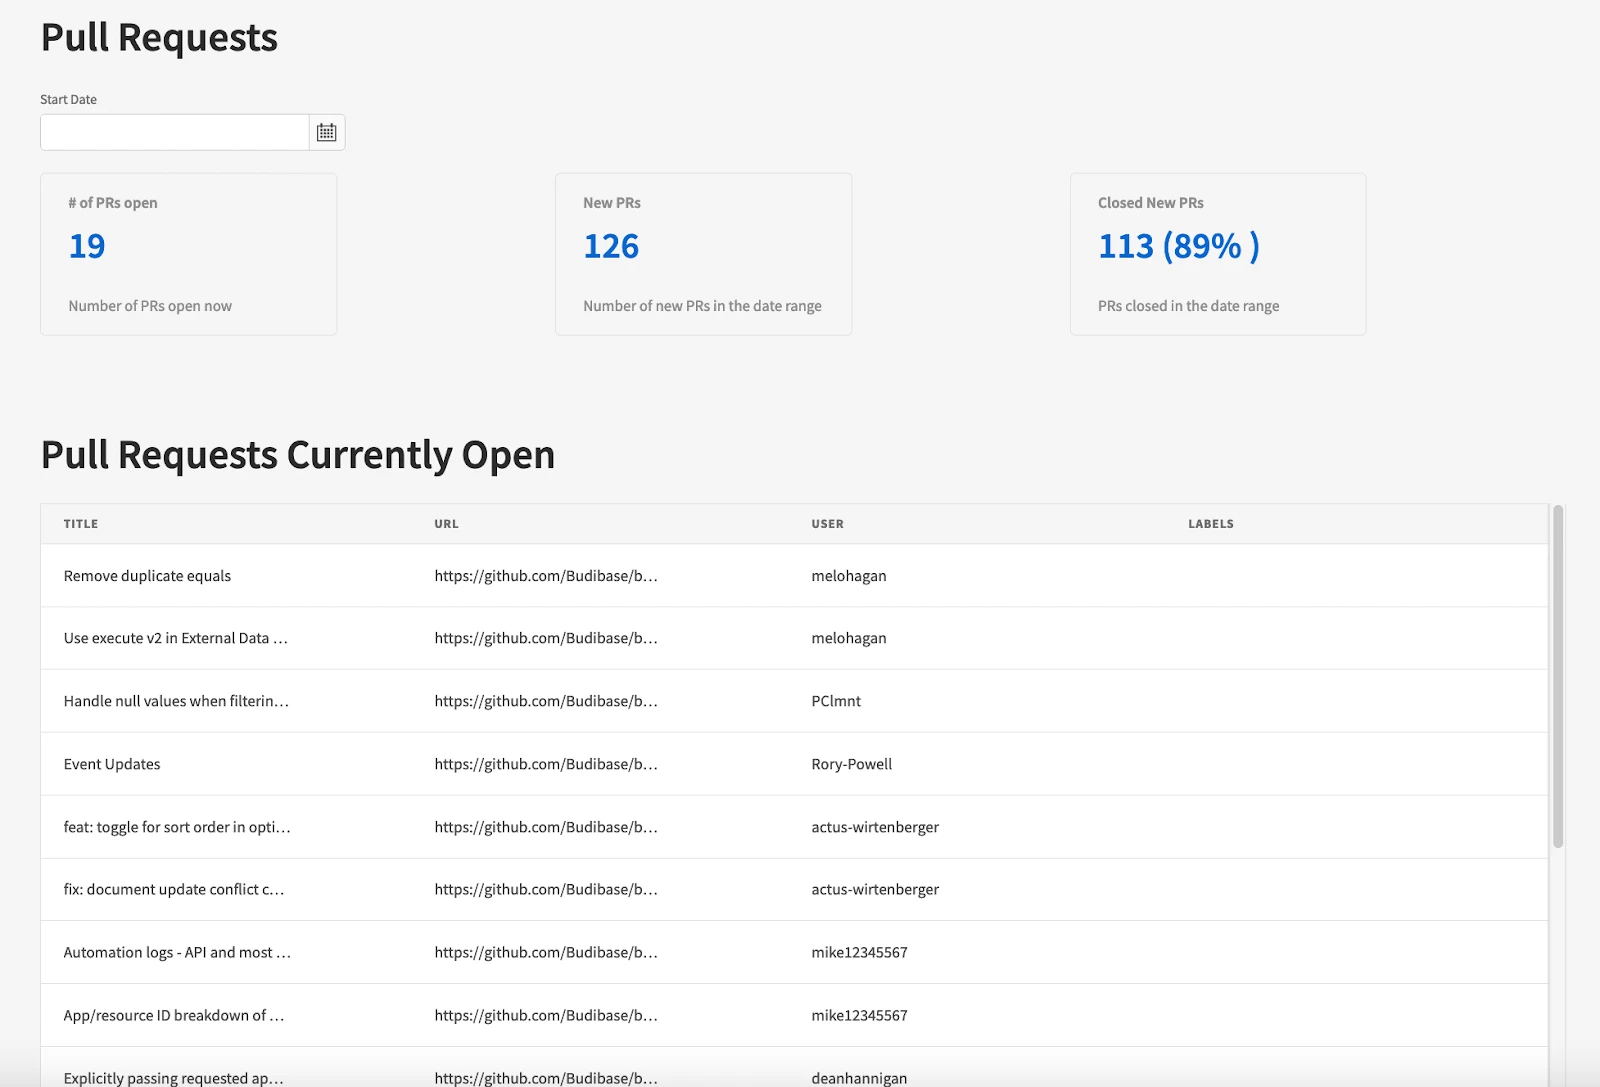
This sample dashboard showcases many of the different techniques you can use to load almost any metric you want to track - like opened issues, open pull requests, or pull request reviews. You can create KPIs, tables, charts, filters, automations, and more.
Here is a bit of information on how you can use each of these components in your decision-making process.
Stats Cards / KPIs

This component allows you to load metrics and KPIs for a quick overview. They can come from a direct API call or from other data sources , including internal and external database tables. With them, you can highlight the main metrics of your project, and track progress on your default branch.
Charts
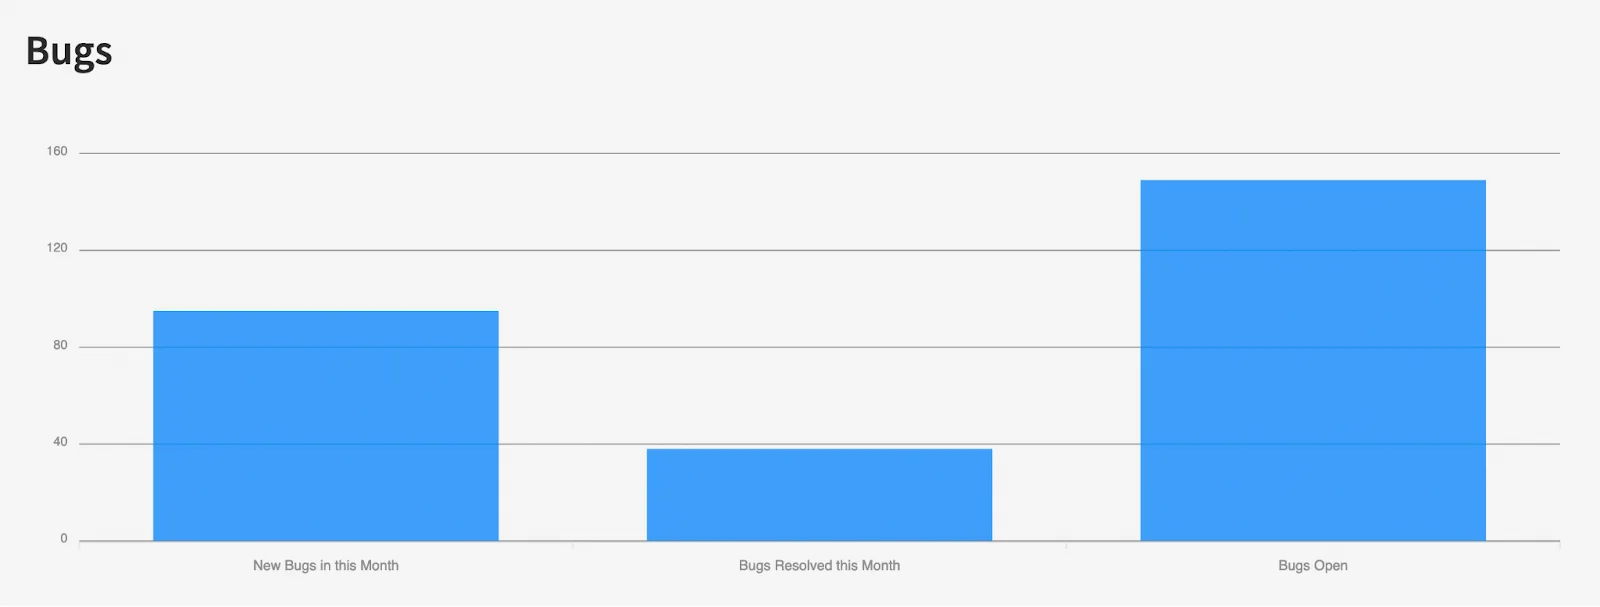
Charts allow team members to understand what is going on in more detail. In our GitHub dashboard, you’ll see a way to create charts combining multiple data sources . This is particularly useful when you can’t change the API response, and you need to merge data from different queries.
Tables
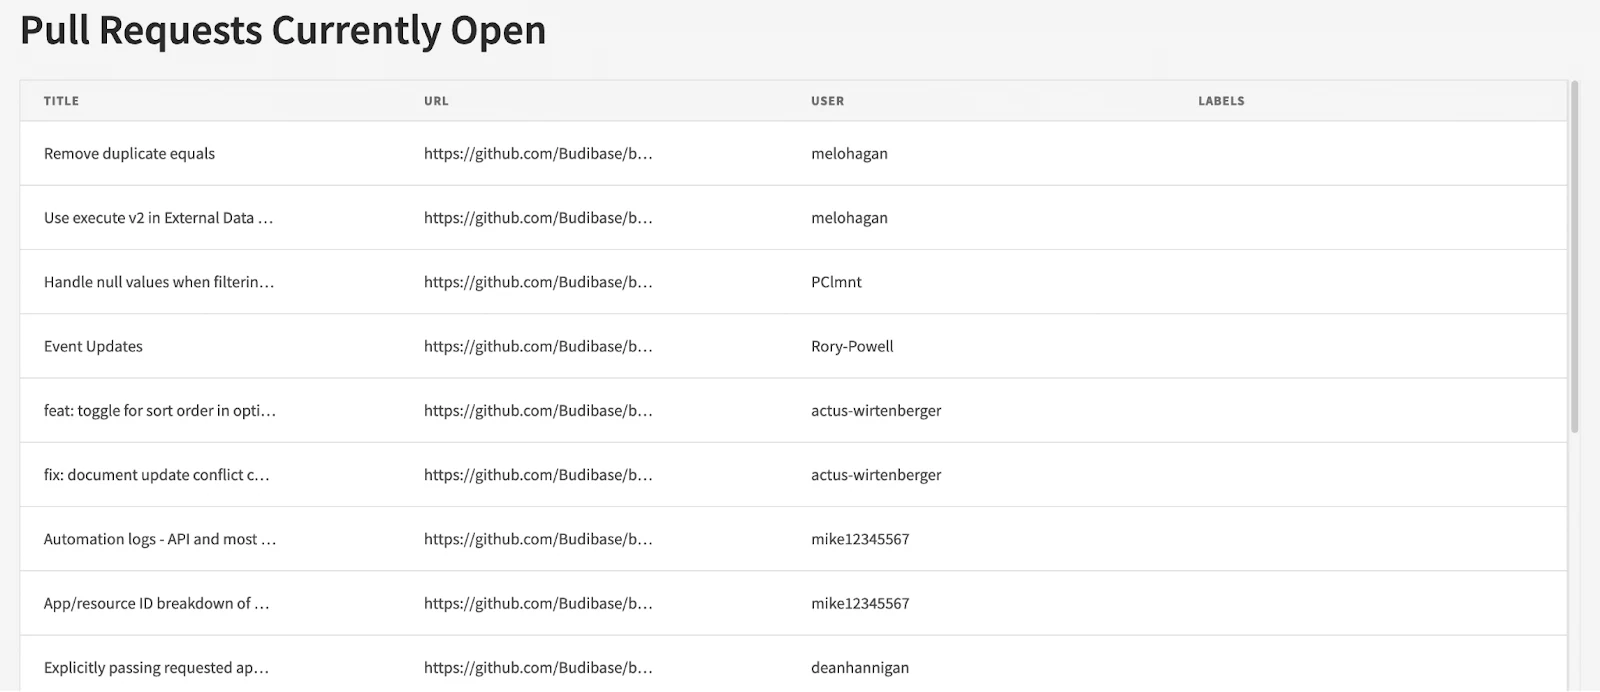
You can use tables to see the details. They are a powerful tool for your GitHub metrics dashboard. You can use charts to understand the big picture, and tables to drill down on specific points that need your attention.
Filters
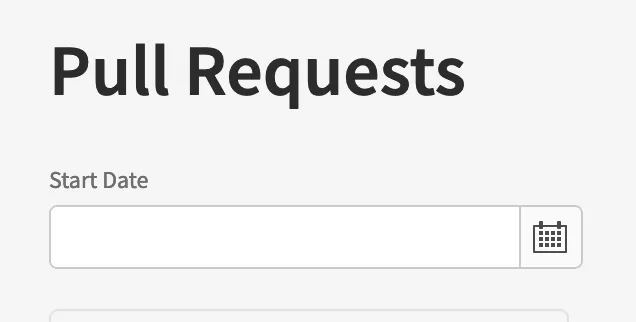
You can use form components to change how your dashboard loads data. With them, you can apply different restrictions such as time scales, data types, filters, and users. Then, you can use these restrictions in your API and database queries to load filtered data.
Admin

In addition to the front-end page, you might want an admin page. In our example, we have the repository as a form option. You can have more options though, such as visibility toggles, styling, user profile restrictions, global filters, and more.
How to create your mockup
You can start to plan your dashboard with a simple pen-and-paper exercise.
Simply listing the kind of information you are trying to get is a quick way to get started.
With the main components in mind, you can use Budibase to build your prototype. Thus, you’ll get a feel of how your dashboard will look. We can edit this later as we begin to introduce different data sources.
If you haven’t already, sign up for a Budibase account. It’s free, and you can our cloud hosting platform for quick deployment.
Then, create your first blank app. Go to the “Design” section.
This is where you can create your visual elements. We are going to create two screens, the main dashboard page, and the settings page.
Our GitHub metrics dashboard will be made up of two screens.
We’ll start by creating a blank screen for our main dashboard, and set this to the app’s home screen. Set your desired access role and you can add the elements you want to your dashboard. Use the toolbar at the top to create blocks and elements:

This is what we have on our page:
- Horizontal container
- Stats card - Current version
- Stats card - Downloads
- Stats card - Stars
- Title - Bugs
- Chart
- Container for Pull Requests
- Form for the date picker
- Title - Pull requests
- Input - date filter
- 3 column section
- Stats card - # of PRs open
- Stats card - New PRs
- Stats card - Closed New PRs
- Title - Pull Requests Currently open
- Table
- Form for the date picker
And this is the structure of components for our settings page:
- Form
- Input - repo
- Button - Save
How to load data for your metrics dashboard
Now you have your mockup ready, we can populate it with real data.
GitHub provides you with two main ways to get data, via REST API access or via the GraphQL API.
The GraphQL API provides custom methods, but it is harder to get started. So let’s use the REST API this time.
You can use it with or without authentication. The truth is that without authentication you’ll have very few requests available. So it’s better if you create a personal access token .
These tokens work like a user/password access for your account. Thus, instead of loading the API path and nothing else, Budibase is going to load the path and send the user credentials. This greatly increases the number of API requests you can make.
Besides using the REST API, you can preprocess your data. This is particularly useful if you want to use data points that aren’t available in the API calls.
For example, in our metrics dashboard, we have the bugs chart. In it, you can see the number of new bugs this month, the number of bugs resolved, and the number of remaining open bugs. But there is no single API call with all this information.
Thus, we preprocess it and save it in a BudibaseDB table.
We also need to save the repository as a setting. We use BudibaseDB for that too.
Now that we have the main methods of gathering data, it’s time to create each of the queries we use in our template.
The settings table
This is a table with three columns:
- Name - the setting name, such as repo.
- Value - the setting value, such as Budibase/budibase.
- Charts - the setting charts, such as bugchart (for the bug reports chart).
To get data from a table, we can use views. In our metrics dashboard, we have 2 views:
- Repo - A view with a filter for “name” equals “repo”, which loads the current setting for the repository to load in your GitHub metrics dashboard
- Bugs Chart - This view loads items with a filter where “charts” contains “bugchart”, which is used to build a chart with the name/value pair. For example, a column with New bugs = 10.
Rest API authentication
Next, we’ll actually configure our API connection. In the main screen for the REST setup, you can add authentication:
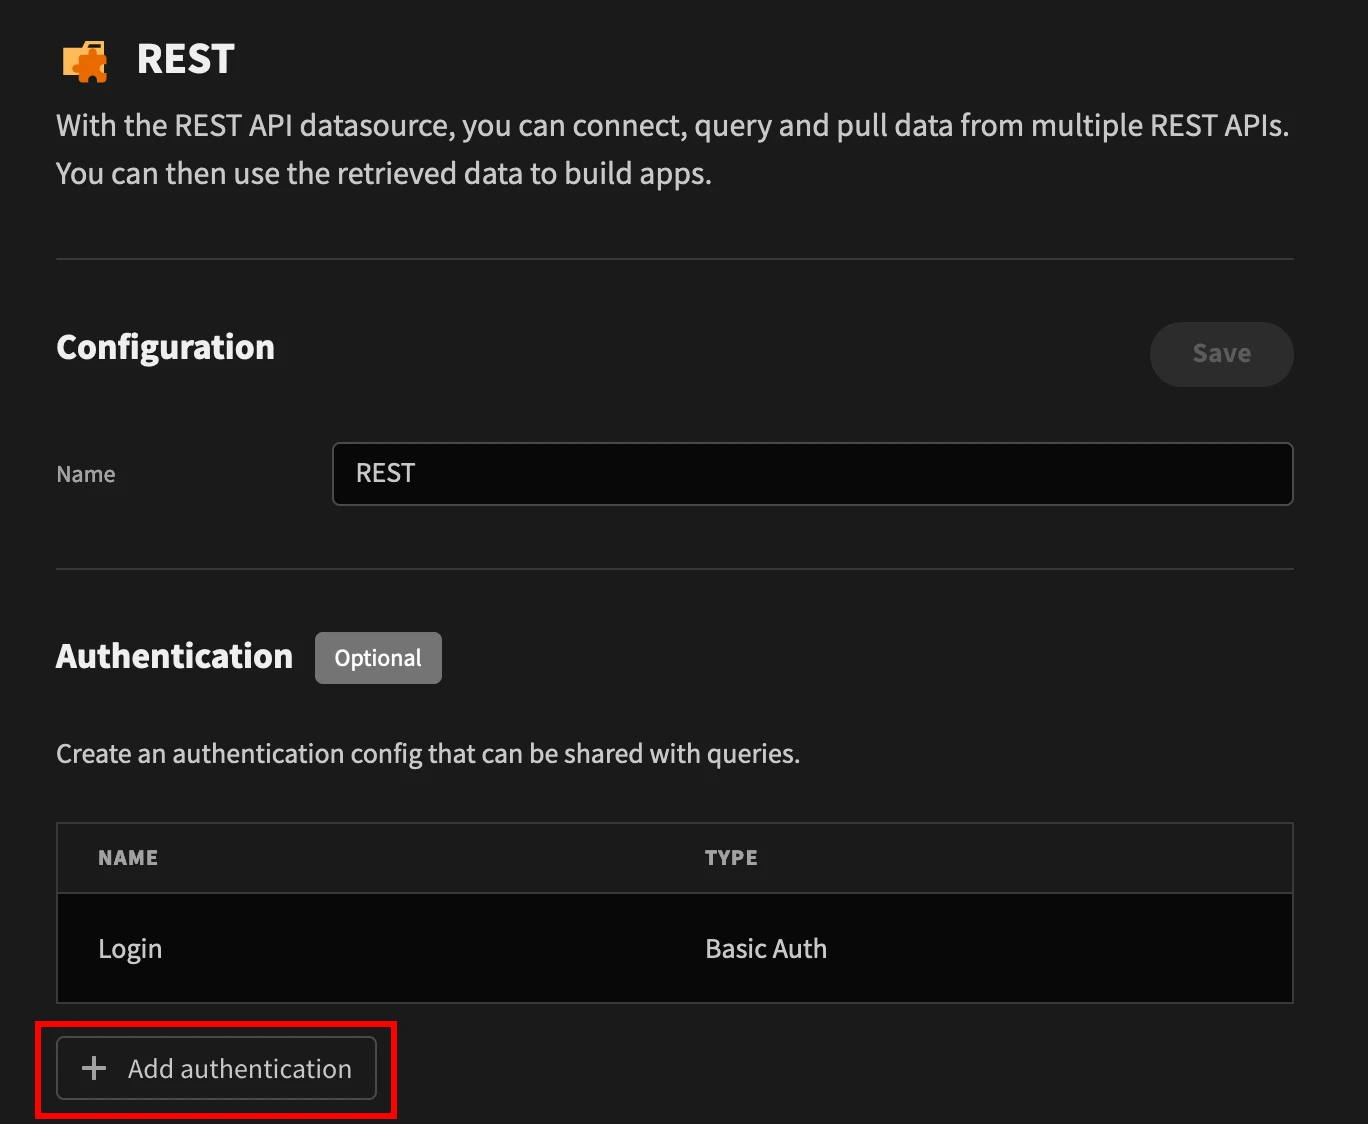
This is where you add your personal access token from GitHub.
REST API queries
We need to load data for your GitHub metrics dashboard. Thus, it’s time to create your API queries.
Don’t forget to select the Auth method created above, like this:

All of your API queries get data using variables. In our metrics dashboard, we have the repo and the start date as variables. But you can add as many variables as you want. These are then accessible in your data providers.
These variables are called bindings. You initialize them like this:

This is what you’d use to create a binding called “repo” with the default value of “Budibase/budibase”. Then, you use this variable in the URL or in the params tab, depending on how your API call is created. Like so:

Here is a list of our queries, URL extensions, and what bindings we are using in each of them.
- Get_list_open_prs - /search/issues?q=+type:pr+repo:{{repo}}+is:open
- Get_monthly_prs - /search/issues?q=+type:pr+repo:{{repo}}+created:%3E={{datecreated}}+sort:created-asc
- Get_monthly_prs_open - /search/issues?q=+type:pr+repo:{{repo}}+created:%3E={{datecreated}}+sort:created-asc+is:open
- Get_open_prs - /search/issues?q=+type:pr+repo:{{repo}}+is:open
- Get_release - /repos/{{repo}}/releases/latest
- Get_repo - /repos/{{repo}}
In addition to the simple queries, we have some special cases. First, there’s the query to get the number of downloads for the latest release. In it, we use the same API call as the get_release
- Get_release_downloads - /repos/{{repo}}/releases/latest
But this API call won’t give us the download count. We need to sum up the downloads in each of the assets. The general structure is:
Count = Data.assets.download_count
Thus, you need to manipulate the API data and return something else. You can do this in the “Transformer” tab.
This is the code we use to return the aggregate download count:
1const assets = data.assets;
2var downloads = 0;
3for ( let asset of assets ) {
4downloads += ( parseInt(asset.download_count) || 0 )
5};
6return downloads;
Take a look at our guide to WebHooks vs APIs .
The other special case is the bug chart. There isn’t a single API call to return data from multiple calls. Thus, you could use GraphQL, an external service to aggregate multiple API calls, or you can use Budibase automations to preprocess your data.
If you want to use Budibase, you can copy what we did for the settings table. Then, you just need to create an automation that updates this data from time to time. For example, if you want to update it daily, you can create an Automation, run it with a cron trigger, and here are the steps:
- Do this: Query rows
- Table: Settings
- Filter: name is repo
- Do this: Query rows
- Table: Settings
- Filter: name is Bugs Open
- Do this: External Data Connector
- Query: get_open_bugs
- Repo: {{ steps.1.rows.[0].[value] }}
- Do this: Update row
- Table: Settings
- Value: {{ steps.3.info.[0].[total_count] }}
- Name: Bugs Open
- Charts: bugchart
- Row ID: {{ steps.2.rows.[0].[_id] }}
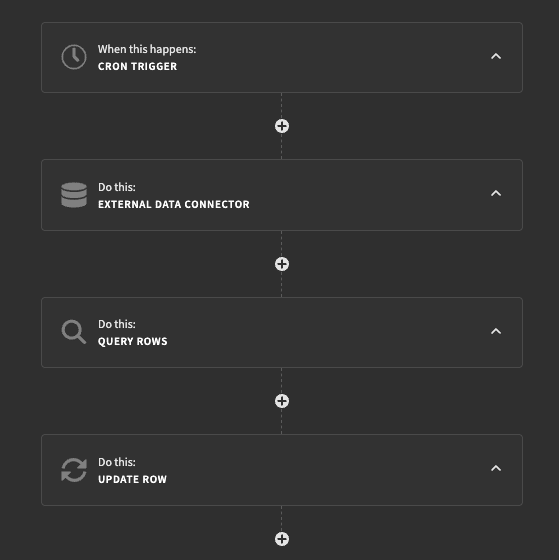
This is a base structure to update the open bugs count. You can repeat steps 2-4 for the other values (new bugs, bugs resolved).
In general, what we do is to:
- Get the repo variable.
- Get the current row for Bugs Open.
- Load the API using the current repo.
- Update the row using the API response and the row ID for bugs open.
The admin page
Let’s head back to our admin page. For demo purposes, it is a public page. But you can change which users can read it, with Budibase’s simple role-based access control system.
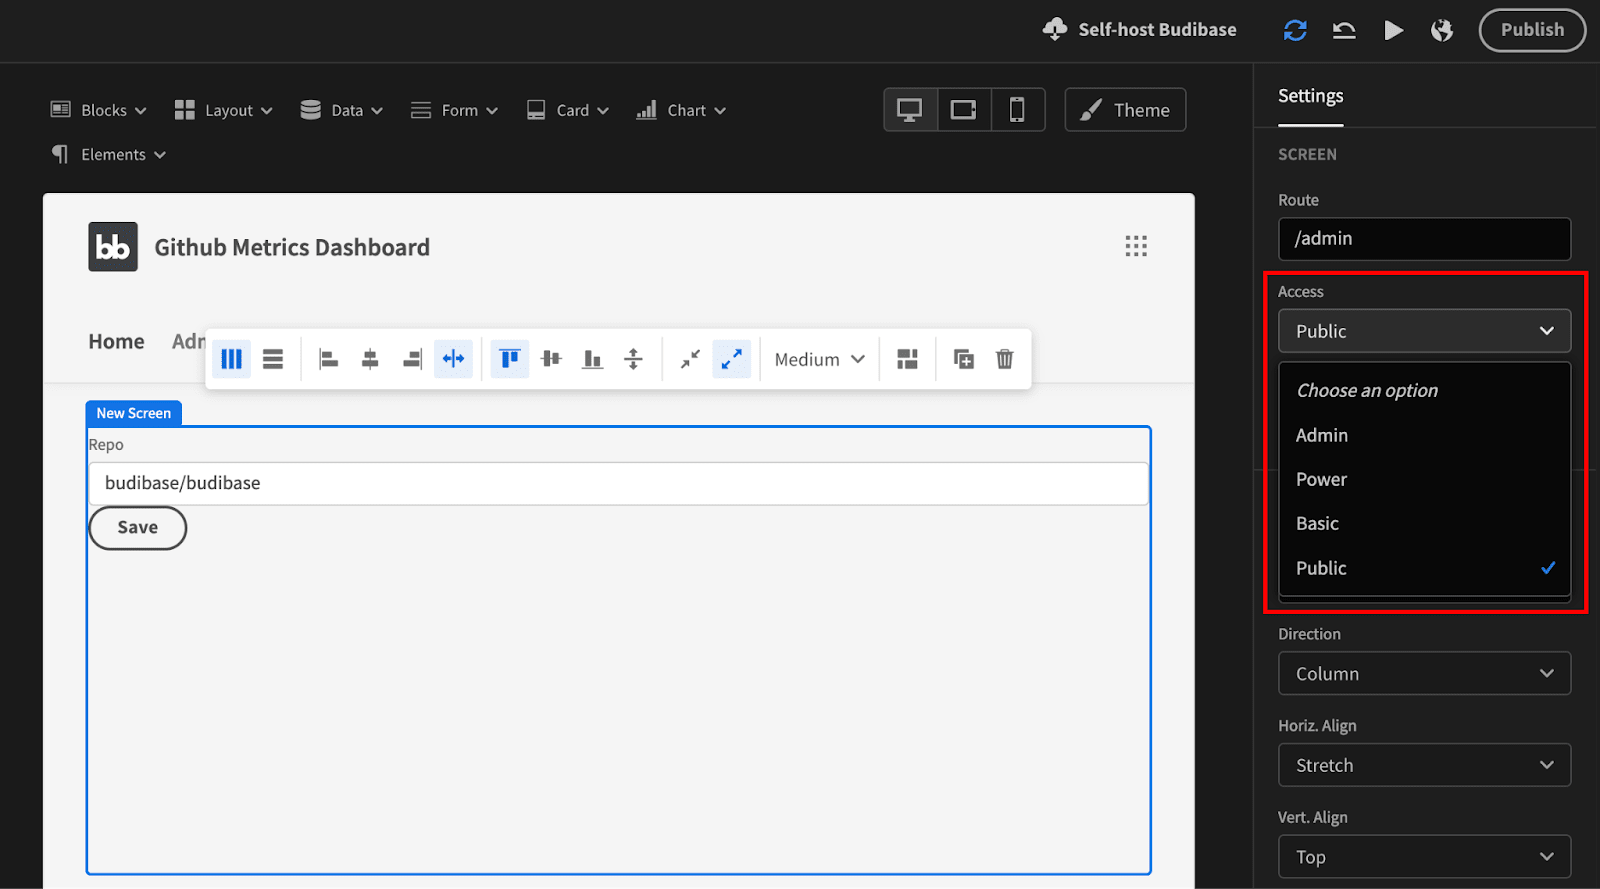
This page contains two visible elements, an input field, and a button to save the options. To make it interactive, we need to know:
- What are the current values for the settings (or the default values)?
- Where is this data saved?
The current values are stored in our BudibaseDB. This means that we need to make this information available to our page. You can load data from any of your data sources using the data provider component.
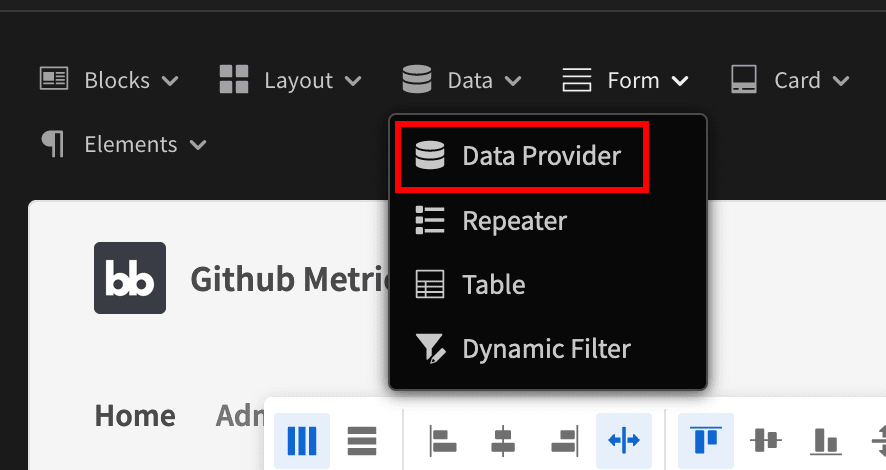
You can add a new data provider, then rearrange elements using drag and drop to move the entire form beneath the data provider. This allows you to access the data from this provider in any of its child elements.
Now you just need to set up your data provider to load the “Repo” view, which contains the currently saved option for the repository to load.
If you try to access this directly from your form input, you’ll notice that the repo setting itself, isn’t there.
This happens because the Repo view is actually an array. And not just that view, all data providers are loaded as an array.
You just need to extract your data from this provider. And you can do it with a data repeater:

You can add a new repeater as a child of the Repo data provider. Then add the form as a child of this repeater.
If you had more than one result for the Repo view, you’d have the entire form repeated. This is a neat way to create repeatable elements, be it from tables or from API calls.
Now you can set up the default value for the input field using this value as the placeholder and default value:
{{ RepoRepeater.Settings.value }}
Next, you need to save the repo value when the “Save” button is clicked. You can do it by using the “OnClick” actions:
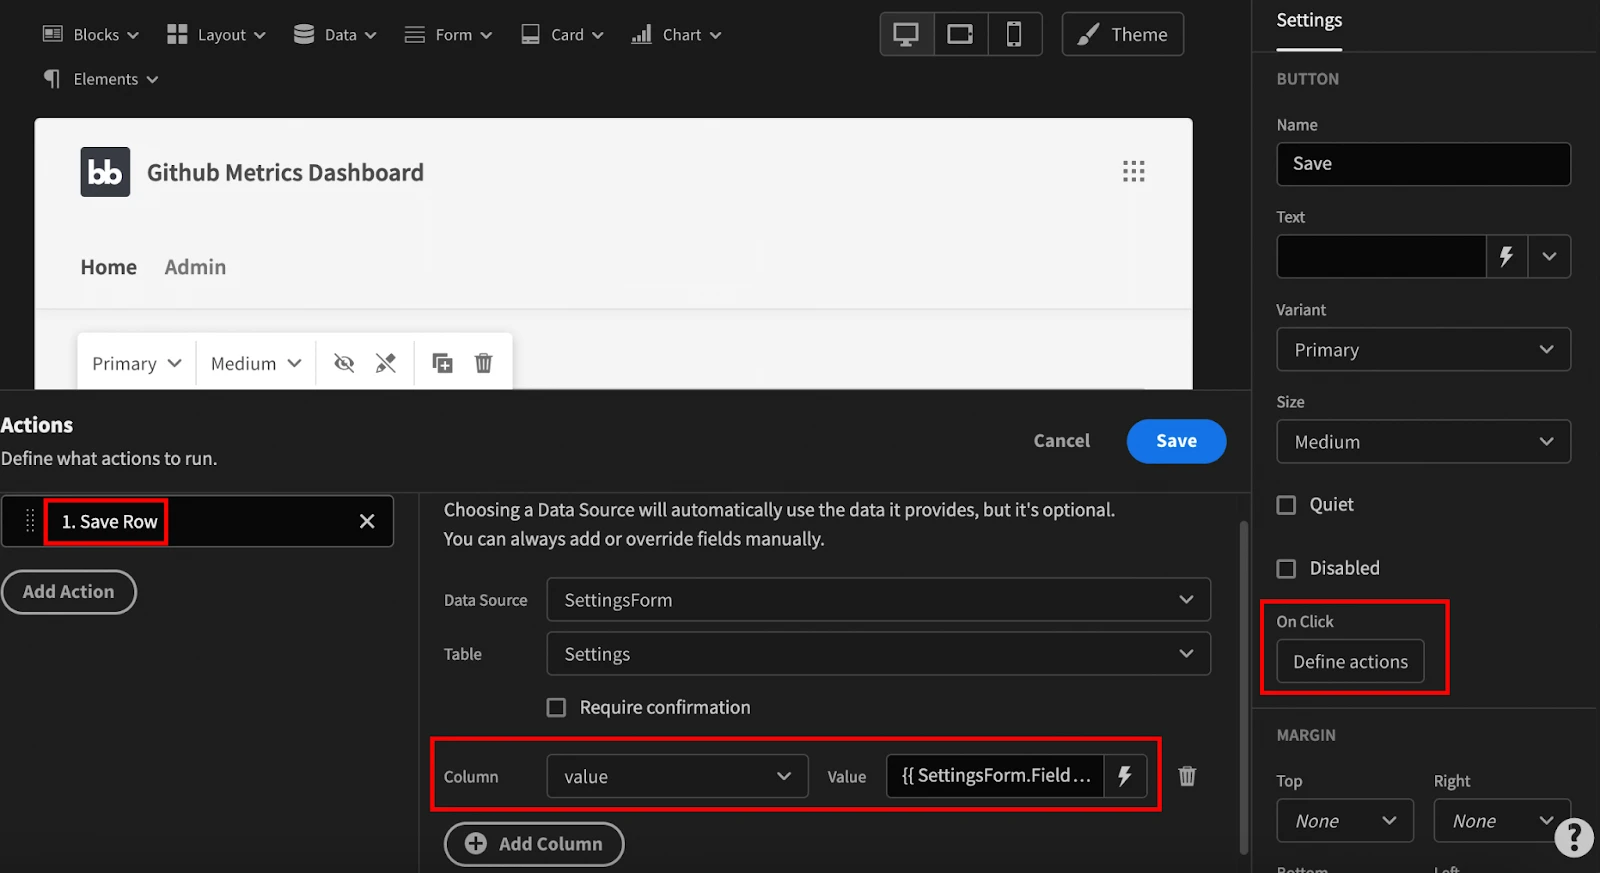
You can set up just one action or multiple actions. In our case, we just need to perform the “Save Row” action. Then use it to update the table settings, The value for the column is this one:
{{ SettingsForm.Fields.value }}
That’s all you need for the template options. Let’s head over to the main dashboard page and edit its components.
The main dashboard settings
The basic mockup for your dashboard is ready. But we need the right data providers to make it dynamic, just like we did for the settings page.
The first data provider that is the parent of the entire page is the provider with the settings repo. This allows you to get the current value for the repository you want to load, making all the API calls dynamic.
This time we won’t use a repeater in it though. That’s because you can use a different method.
Since the data provider gives you an array, you can debug its value using something like this in any of your text components:
{{ SettingsRepo.Rows }}
You’ll notice that it is just a JS array, like this:
[ { “name”:“repo”, “value”:“budibase/budibase”, “tableId”:“ta_d52….”, […] } ]
Since this is just an array, you can access its value with a code snippet like this one:
{{ SettingsRepo.Rows.[0].[value] }}
In it, we are just loading the “value” property for the first (and only) result in the SettingsRepo data provider.
Creating the stats card
Your KPIs are already in place. But you need data providers for each of them.
The first card uses the get_release query. Add a new data provider for it, but this time in its options you can pass the repo saved in your settings:
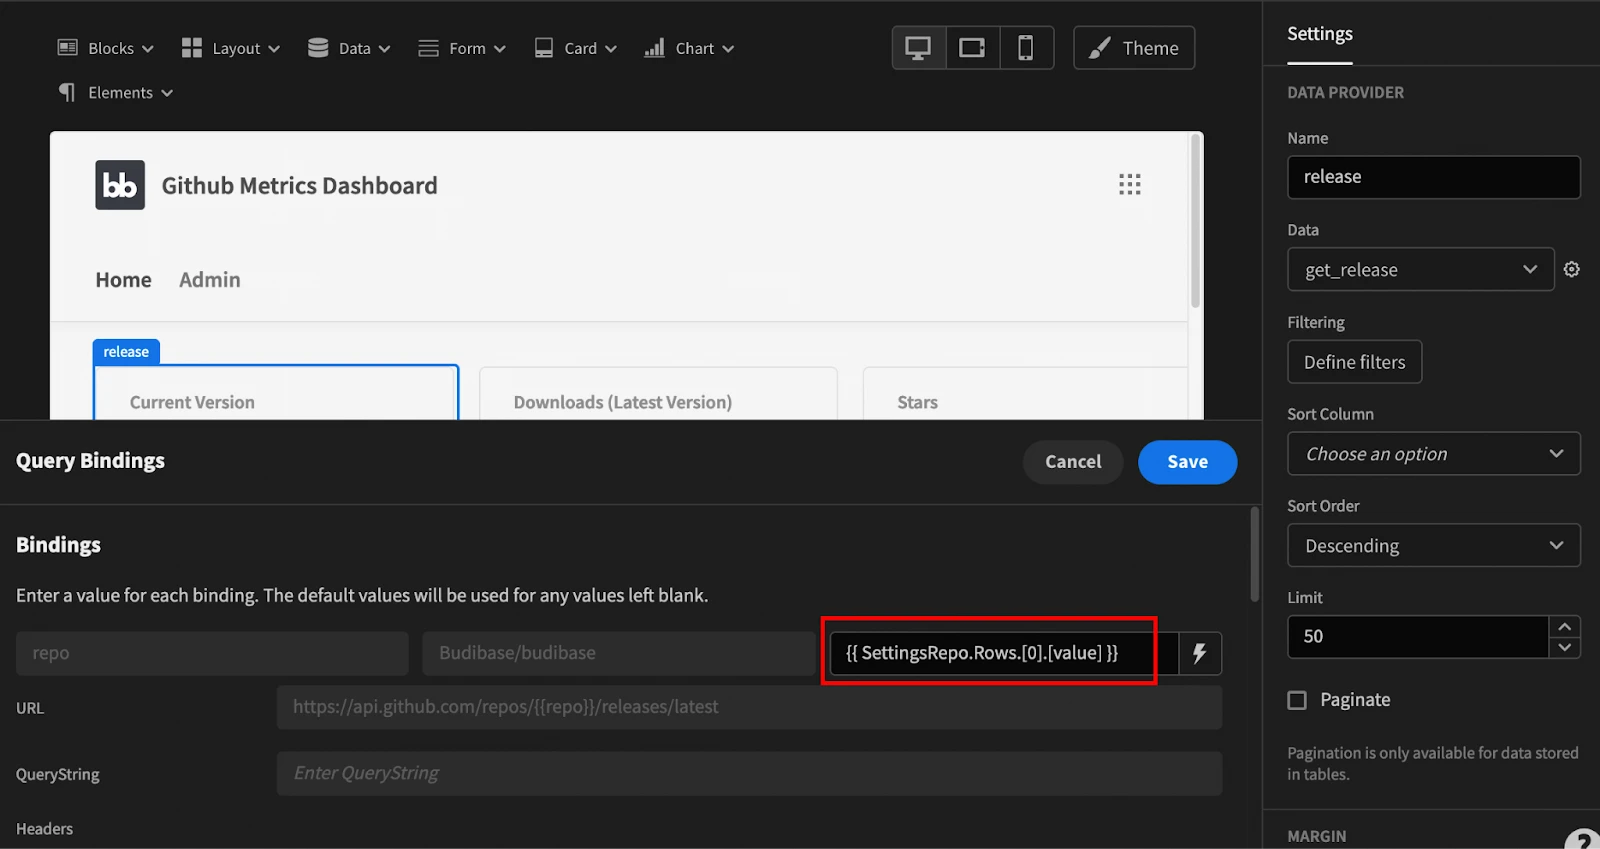
In order to get the actual release version, you can use a repeater or get the property from the data provider using JS code.
If you are using a repeater, the value for your stats card will look like this:
{{ releaseRep.get_release.name }}
And for the JS method, it’ll look like this:
{{ release.Rows.[0].[name] }}
For the next elements in this tutorial, we’ll assume that you’re using repeaters. But you can always refer back to this section in case you don’t want to use them.
The downloads card just uses the get_release_downloads API call. Just make sure you add the repo as a variable in it as you did for the latest version.
You can use the get_repo query to get the number of stars in your repository. But if you have a lot of stars, your count might look weird. You can make it better using the addCommas handlebar helper:
{{ addCommas starsRep.get_repo.stargazers_count }}
These helpers allow you to modify the data from a variable. They aren’t as flexible as pure JS code, but they are quite useful for simple operations. Check out the full list of handlebars helpers in Budibase .
How to render the bugs chart
Just like the other items, the chart needs a data provider. In this case, you should load the Bugs Chart view for the settings table.
Then, just drag the chart so it is a child of the data provider and adjust its settings. You need to use the label column as “name” and the data columns as “value”.
Create and apply dashboard filters
The technique here is very similar to what you did in the settings table. You just need to make sure that all queries that are filtered by your form are inside of it. This allows the form data to be used in them.
The number of new PRs has two bindings, the repository, and the start date. The repo binding is just like you did for the other queries, but the start date is like this:
{{ formdatepick.Fields.date }}
In this case, the date field has our desired formatting. But you could use JS functions or others to change it if you want.
For example, the number of closed new PRs comes from the combination of the number of new PRs open and the number of new PRs in general. After you add these data providers nested to each other, you can use this JS code:
1var closed = parseInt( $("newprs.Rows")[0]['total_count'] )
2parseInt( $("newOpenPrs.Rows")[0]['total_count'] )
3var percent =
4parseInt(100*(1-(parseInt($("newOpenPrs.Rows")[0]['total_count'])
5/parseInt($("newprs.Rows")[0]['total_count']))))
6return closed + " (" + percent + "% ) "
How to load a data table
The data table just requires a data provider as its parent. In the example, you should add the get_list_opne_prs provider and the table inside of it.
If you want, you can hide some columns using the data transformers, similar to what you did to get the download count. Here is an example to remove most columns in the get_list_open_prs:
1return data.items.map(
2( {title, html_url, user, labels} ) =>
3( {
4title,
5url: html_url,
6user: user.login,
7labels: labels.map( ({name}) => (name) ).toString()
8} )
9)
Check out our round-up of the most common web app ideas .
Building a GitHub metrics dashboard in Budibase
Today you’ve learned how to build a GitHub metrics dashboard. In addition, you’ve learned how development teams can load and process data using Budibase. By the end of the day, you should be able to create your own dashboards, loading custom elements with filtering options, styling, charts, and more.
To find out more about the kinds of tools you can create with Budibase, have a look at our product page .
We hope you’ve enjoyed it, and see you again next time!
For more inspiration, check out our range of pre-built app templates.